

Maintaining filter performance through monitoring
Continuous monitoring keeps cleanroom filtration within specification while controlling energy and lifecycle cost.
Treat filter health as a measurable parameter—trend it, alarm it, and act on data.
Differential pressure (ΔP) tracking and energy optimization
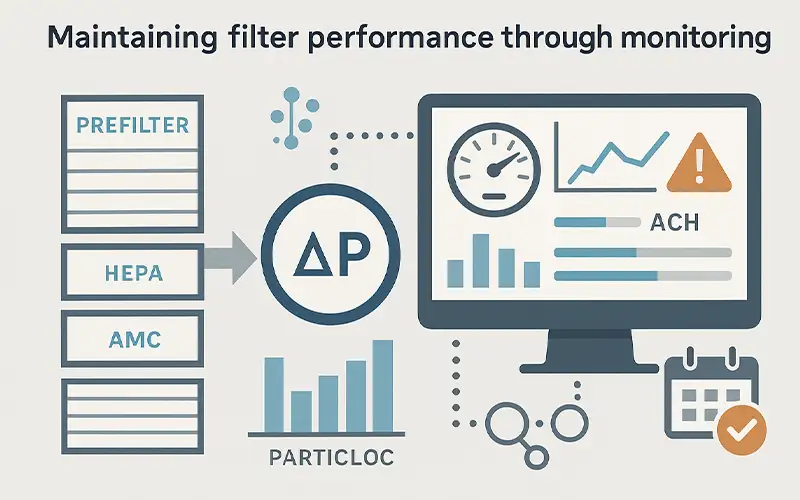
Log ΔP across each stage (prefilter, final HEPA/ULPA, AMC if used) at steady operating points.
Rising ΔP signals loading; compare to baseline and fan curves to avoid starving hoods or overspeeding fans.
Use setpoint bands (watch/action) and correlate ΔP with supply velocity and particle counts to confirm true capacity loss. Optimizing changeouts at the knee of the ΔP curve reduces fan power and stabilizes airflow.
Scheduled replacement intervals based on risk and performance data
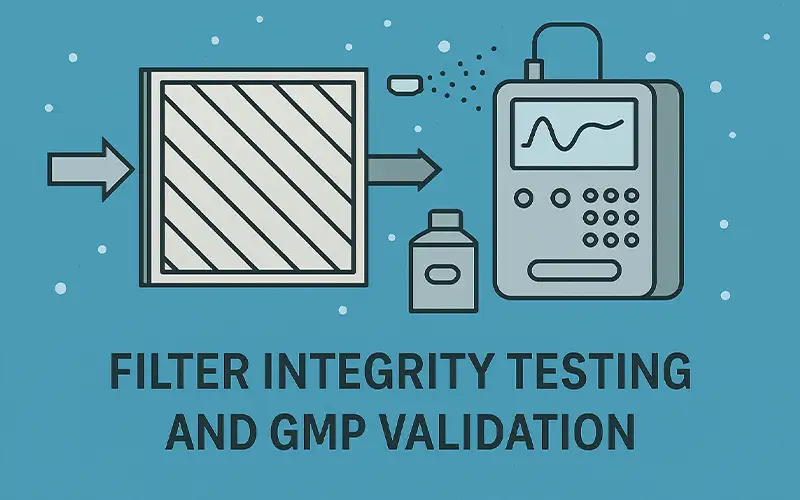
Move from fixed calendars to risk-based intervals informed by ΔP trends, process intensity, and historical fouling rates. After maintenance, verify recovery with airflow/velocity checks and leak/scan tests.
Document results to maintain the qualified state and support ongoing classification per ISO 14644-2 (monitoring to provide evidence of cleanroom performance).
Benefits of real-time monitoring and sensor-based maintenance
Networked pressure, velocity, temperature/humidity, and particle sensors feed a BMS/EMS for dashboards, alerts, and predictive analytics.
Real-time data detects early drift (e.g., gasket leaks, fan imbalance) before it becomes a batch risk, enables condition-based service, and simplifies audit readiness. E
U GMP Annex 1 emphasizes documented environmental control and periodic verification; aligning monitoring with its expectations strengthens compliance and batch consistency.


Leave a comment